ENGLISH FOLLOWS BELOW
こんにちは、たむたむ(@tamtam180)です。 SmartNewsでは主に広告の配信サーバを書いています。
最近、PipelineDBというContinuous Queryをサポートする製品を導入したのでそのレポートを書きます。 なお、セットアップ方法は本家のサイトを見れば誰でも出来るので、そのあたりは割愛します。
競合にあたる製品としては、NorikraやAzureのStream Analyticsがあり、日本のエンジニア界隈ではNorikraを好んで使用していると思います。
私がPipelineDBを導入した理由は、PipelineDBがPostgreSQL(9.4)をベースにしているため、弊社が導入しているダッシュボードツール、Chartioとの相性が良かったからです。
PipelineDBとは
PipelineDBは、PostgreSQLをベースにContinuous Query(View)をサポートしたOSSプロダクトです。 動作原理としては、Streamを定義し、そのStreamを参照するContinuous viewを定義します。そのviewの定義に従って、細かいTime Windowsで集計された結果をテーブルに保存していき、Viewの参照時にそれらを束ねて結果を表示します。 Streamを参照しているViewが存在しない場合は、データは捨てられます。PipelineDBの良い点
- PostgreSQLをベースにしているため、接続するための労力が低い(既存のものを使えるため)
- Distinct countが強力
- HyperLogLog(HLL)でカウントしており、HLLのMergeもサポートしているため、1分毎のDistinct countを計算しつつ、それらcounterから1時間単位のunique count, 1日単位のunique countを算出することができます。
- HLLは異なり数を推定するので、厳密な値ではありませんが十分実用な精度です。
ユースケース
- バッチ処理ではできない、広告の各種速報値ダッシュボード
- nginxのstatusのようなsystem metricsではなく、アプリケーションレイヤーのログの速報値。
- 例えば、広告主、キャンペーン、デバイス、メディア単位の時系列Metrics
- 異常値検出
- 例えばこちらの本の9章にあたる内容
構成
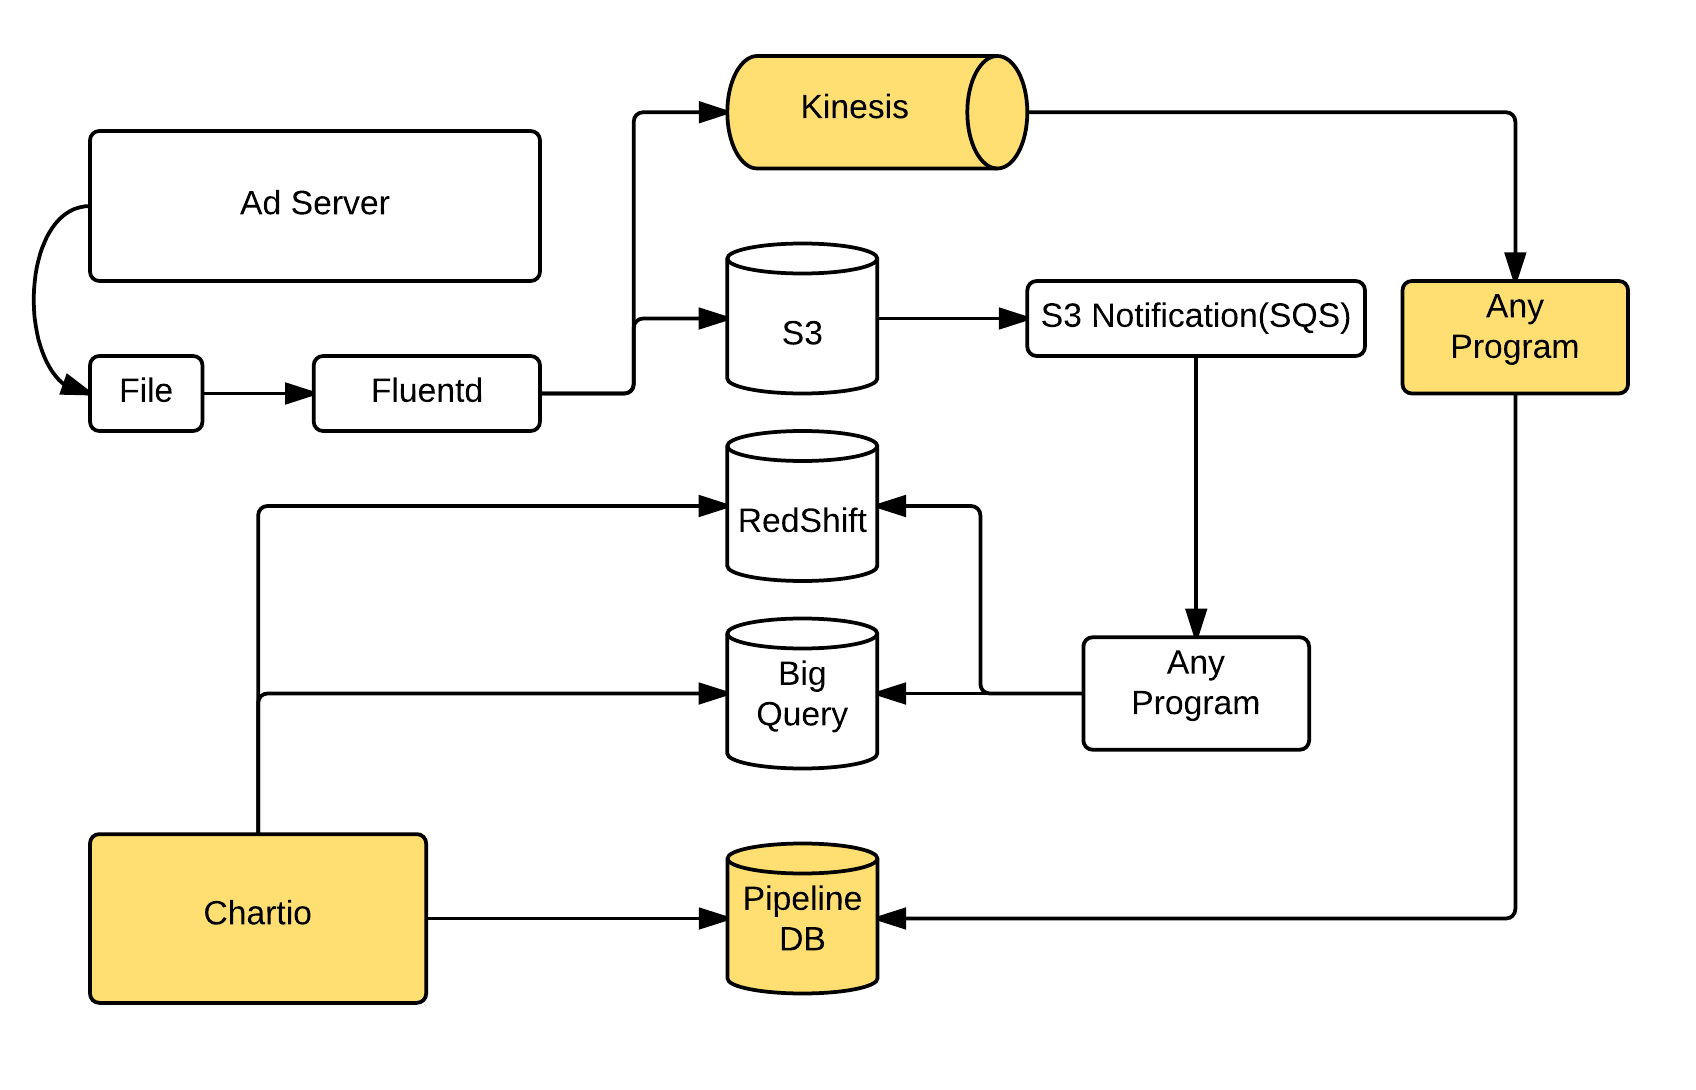
Kinesis + PipelineDB + Chartio という構成です。 現在、以下の図(全容ではありません.概要です.)のように広告の一部のログをKinesisにも入れています。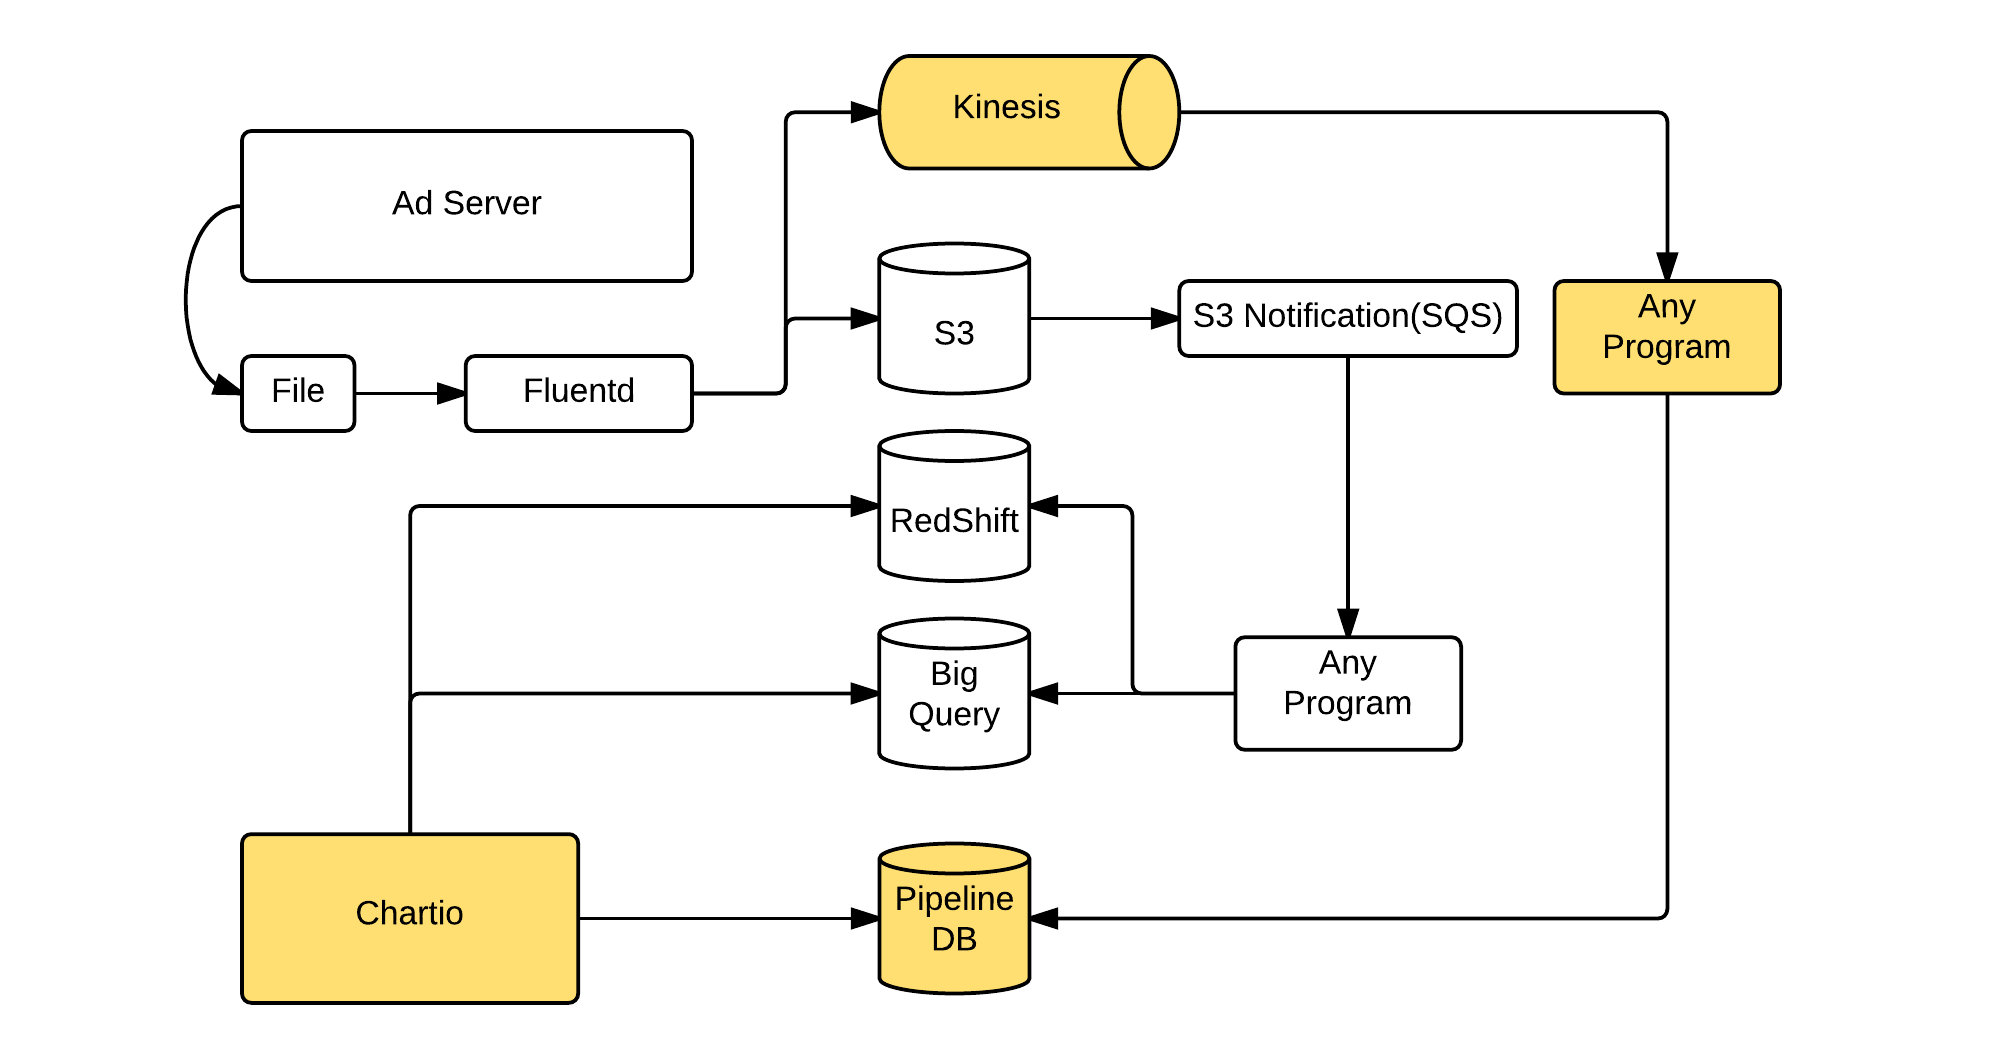
Kinesisには、1レコード1JSON Objectの形式で記録しています。 このデータをRubyのprogramから吸い上げています。RubyではKinesisの各Shardの読み取り状況をLevelDBに記録し、吸い上げたレコードをPipelineDBにbulk insertで入れています。 PipelineDBのstreamは、以下のように1列JSONBの定義にしています。
CREATE STREAM imp_stream ( item JSONB );
このようにすることで、データの投入部分を修正する必要がないので、あとはContinuous Viewを作るだけでデータを見られるようになります。
Continuous viewの例
CREATE CONTINUOUS VIEW imp_count AS
SELECT
  COUNT(*) as cnt,
  MAX( (item->>'timestamp')::bigint ) as last_timestamp
FROM imp_stream
WHERE
  hour(arrival_timestamp) > clock_timestamp() - interval '30 days';
0.7.7では、arrival_timestmapにhourやminuteを使うことができなかったのですが、0.8から使えるようになりました。これはGROUP BYを含んだviewを作るときに重要です。
次の例は、配信量のスムージングをしているキャンペーンについて、JSTのHour単位でその量を確認するためのクエリです。
CREATE CONTINUOUS VIEW plus_imp_ymdh AS
SELECT
  (item->>'campaignId')::bigint as campaignId,
  (item->'channelId')::bigint as channelId,
  to_char(to_timestamp((item->>'timestamp')::bigint + 3600*9), 'YYYY-MM-DD') as ymd_jst,
  date_part('hour', to_timestamp((item->>'timestamp')::bigint + 3600*9)) as h_jst,
  COUNT(*) as cnt
FROM imp_stream
WHERE
  hour(arrival_timestamp) > clock_timestamp() - interval '10 days'
  AND (item->>'productCode')::text = 'xxx'
GROUP BY
  campaignId, channelId, ymd_jst, h_jst;
次はDistinct countを含んだクエリで、A/B Testの割り当て状況を算出するクエリです。
A/B Testの内容毎に、1日単位のUnique Countを数えています。
2日分のUnique数が必要な場合は、ucnt列がHLLなので、hll_union_aggを使うことで推定値を算出することが可能です。
以下のクエリの場合、1日分に関しては GROUP BY + Count Distinctの定義により、自動でHLLの計算がされます。
CREATE CONTINUOUS VIEW abt_allocation AS
SELECT
  to_char(to_timestamp((item->>'timestamp')::bigint + 3600*9), 'YYYY-MM-DD') as ymd_jst,
  (item->>'abtExpLabel')::text as abt_exp_label,
  (item->>'abtGrpLabel')::text as abt_grp_label,
  count(distinct (item->>'uuid')::text) as ucnt
FROM ads_stream
WHERE hour(arrival_timestamp) > clock_timestamp() - interval '3 days'
GROUP BY ymd_jst, abt_exp_label, abt_grp_label
;
1秒単位のHistogramを作りたいとかでない場合は、arrival_timestampはminute(arrival_timestamp)のように、最低でもminuteは付けておいた方が良いと思います。
こちらを制御することで、実データが格納されている、****_mrel0 をコンパクトにすることができます。
なお、1時間単位のGroupByをしているからといって1時間経過しないと参照できないということはありません。この場合は、1時間毎のBinに対して随時計算されていきます。
ダッシュボード
以下はDashボードのサンプルです。このような感じで可視化をしています。 本物のデータではないので、値は適当に誤魔化しています。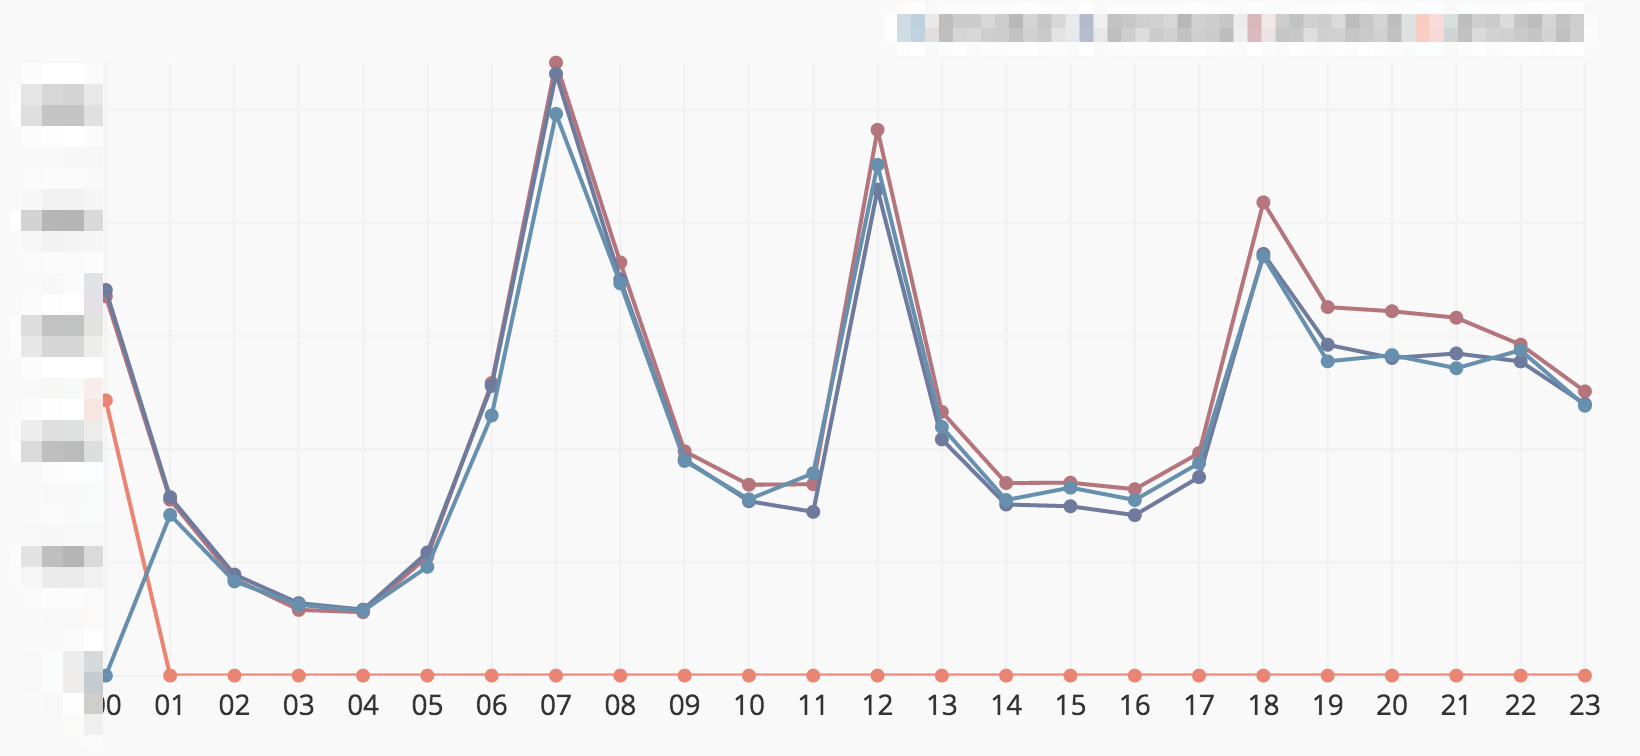


まとめ
Viewを定義する前の情報を参照することはできませんが、速報値を参照するのにはとても便利です。 また時系列のデータを一定期間保存しておけるため、異常値検出のためのデータにも使えます。それ他の製品(norikra や kibana)でもできるよ、というツッコミがありそうですが、他のDashboardからアクセスできるということ、またHLLをサポートしていることがとても気に入っています。
なお、弊社スマートニュースではエンジニアを随時募集しております。 何か質問がありましたら、この記事に限った話ではなく、お気軽に @tamtam180 までお問い合わせください。
How SmartNews Utilizes PipelineDB
Hello, I am @tamtam180 at SmartNews as Ads Enginner.Today let me introduce how SmartNews utilizes PipelineDB, which is an RDB product supporting Continuous Query. SmartNews adopted PipelineDB mainly because of its significant benefit in combination with Chartio, which is a popular visualizing dashboard tool that SmartNews has deeply exploited.
( About Continuous Query, readers can refer other alternatives such as Norikra, which is popular among other Japanese engineers, or Azure Stream Analytics, while we highly valued the high connectivity to Chartio. )
Good points
- Applicability of an existing driver: PipelineDB is based on PostgreSQL and hence usage of PostgreSQL drivers eases our development.
- Computational efficiency of distinct counting command, thanks to HyperLogLog (HLL) and its merging functionalities.
- Merging multiple HLL enables efficient aggregation among different time scales, e.g., 1-hour statistics is efficiently computed as the aggregation of multiple 10-minute statistics.
- The HyperLogLog’s intrinsic error, which stems from its probabilistic approximation nature, has been never problematic in our practice.
- We are satisfied with the significant performance improvement in version 0.8.0, compared to the initial version 0.7.7.
Use case
- Various flash report of advertising (It cannot be in batch processing)
- For example: Time series metrics per advertiser, campaign, device, media, etc..
- Anomaly detection
System configuration: an efficient combination of PipelineDB, Kinesis, and Chartio.
One key idea to simplify all of the required post processing as merely Continuous View: storing parts of logs into Kinesis.- One JSON Object for each record
- Bulk insert of these records into PipelineDB
- Storing the running status of each of the Kinesis Shared into LevelDB
- One-column JSONB field in PipelineDB
CREATE STREAM imp_stream ( item JSONB );
Examples of using Continuous View
CREATE CONTINUOUS VIEW imp_count AS
SELECT
  COUNT(*) as cnt,
  MAX( (item->>'timestamp')::bigint ) as last_timestamp
FROM imp_stream
WHERE
  hour(arrival_timestamp) > clock_timestamp() - interval '30 days';
The following SQL example provides a good understanding about the benefit of hourly GROUP BY syntacs. Here we retrieve the smoothed amount of ad supply.
CREATE CONTINUOUS VIEW plus_imp_ymdh AS
SELECT
  (item->>'campaignId')::bigint as campaignId,
  (item->>'channelId')::bigint as channelId,
  to_char(to_timestamp((item->>'timestamp')::bigint + 3600*9), 'YYYY-MM-DD') as ymd_jst,
  date_part('hour', to_timestamp((item->>'timestamp')::bigint + 3600*9)) as h_jst,
  COUNT(*) as cnt
FROM imp_stream
WHERE
  hour(arrival_timestamp) > clock_timestamp() - interval '10 days'
  AND (item->>'productCode')::text = 'xxx'
GROUP BY
  campaignId, channelId, ymd_jst, h_jst;
Let us provide another SQL example as a usage of distinct count. The application is also in ad domain, where we compute the statistics of the assignment in A/B test.
CREATE CONTINUOUS VIEW abt_allocation AS
SELECT
  to_char(to_timestamp((item->>'timestamp')::bigint + 3600*9), 'YYYY-MM-DD') as ymd_jst,
  (item->>'abtExpLabel')::text as abt_exp_label,
  (item->>'abtGrpLabel')::text as abt_grp_label,
  count(distinct (item->>'uuid')::text) as ucnt
FROM ads_stream
WHERE hour(arrival_timestamp) > clock_timestamp() - interval '3 days'
GROUP BY ymd_jst, abt_exp_label, abt_grp_label
;
If you do not need the detail histogram, we recommend to use the minute with arrival_timestamp. By doing so, ****_mrel0 (the actual data is stored) becomes compact.
Dashboard
Here the underlying dataset is artificial, due to confidentiality considerations.
Conclusion
We introduced how SmartNews uses PipelineDB and the rationale behind our adoption. We particularly noticed the time-series nature of our data, where both business and engineering decision making must be done based on the freshest information.The primal discipline in such rational decision making is to check the newest indicators, which has been enabled through the high connectivity with dashboards including Chartio, and support of HyperLogLog functionality.
The second discipline, of which we now consider the introduction, is anomaly detection for improving service level.
Here PipelineDB’s high capacity to store lengthy time-series will greatly ease the application of advanced anomaly detection algorithms, without significant overhead in data processing.
We are hiring!! If you have any questions, please contact me.